Case study
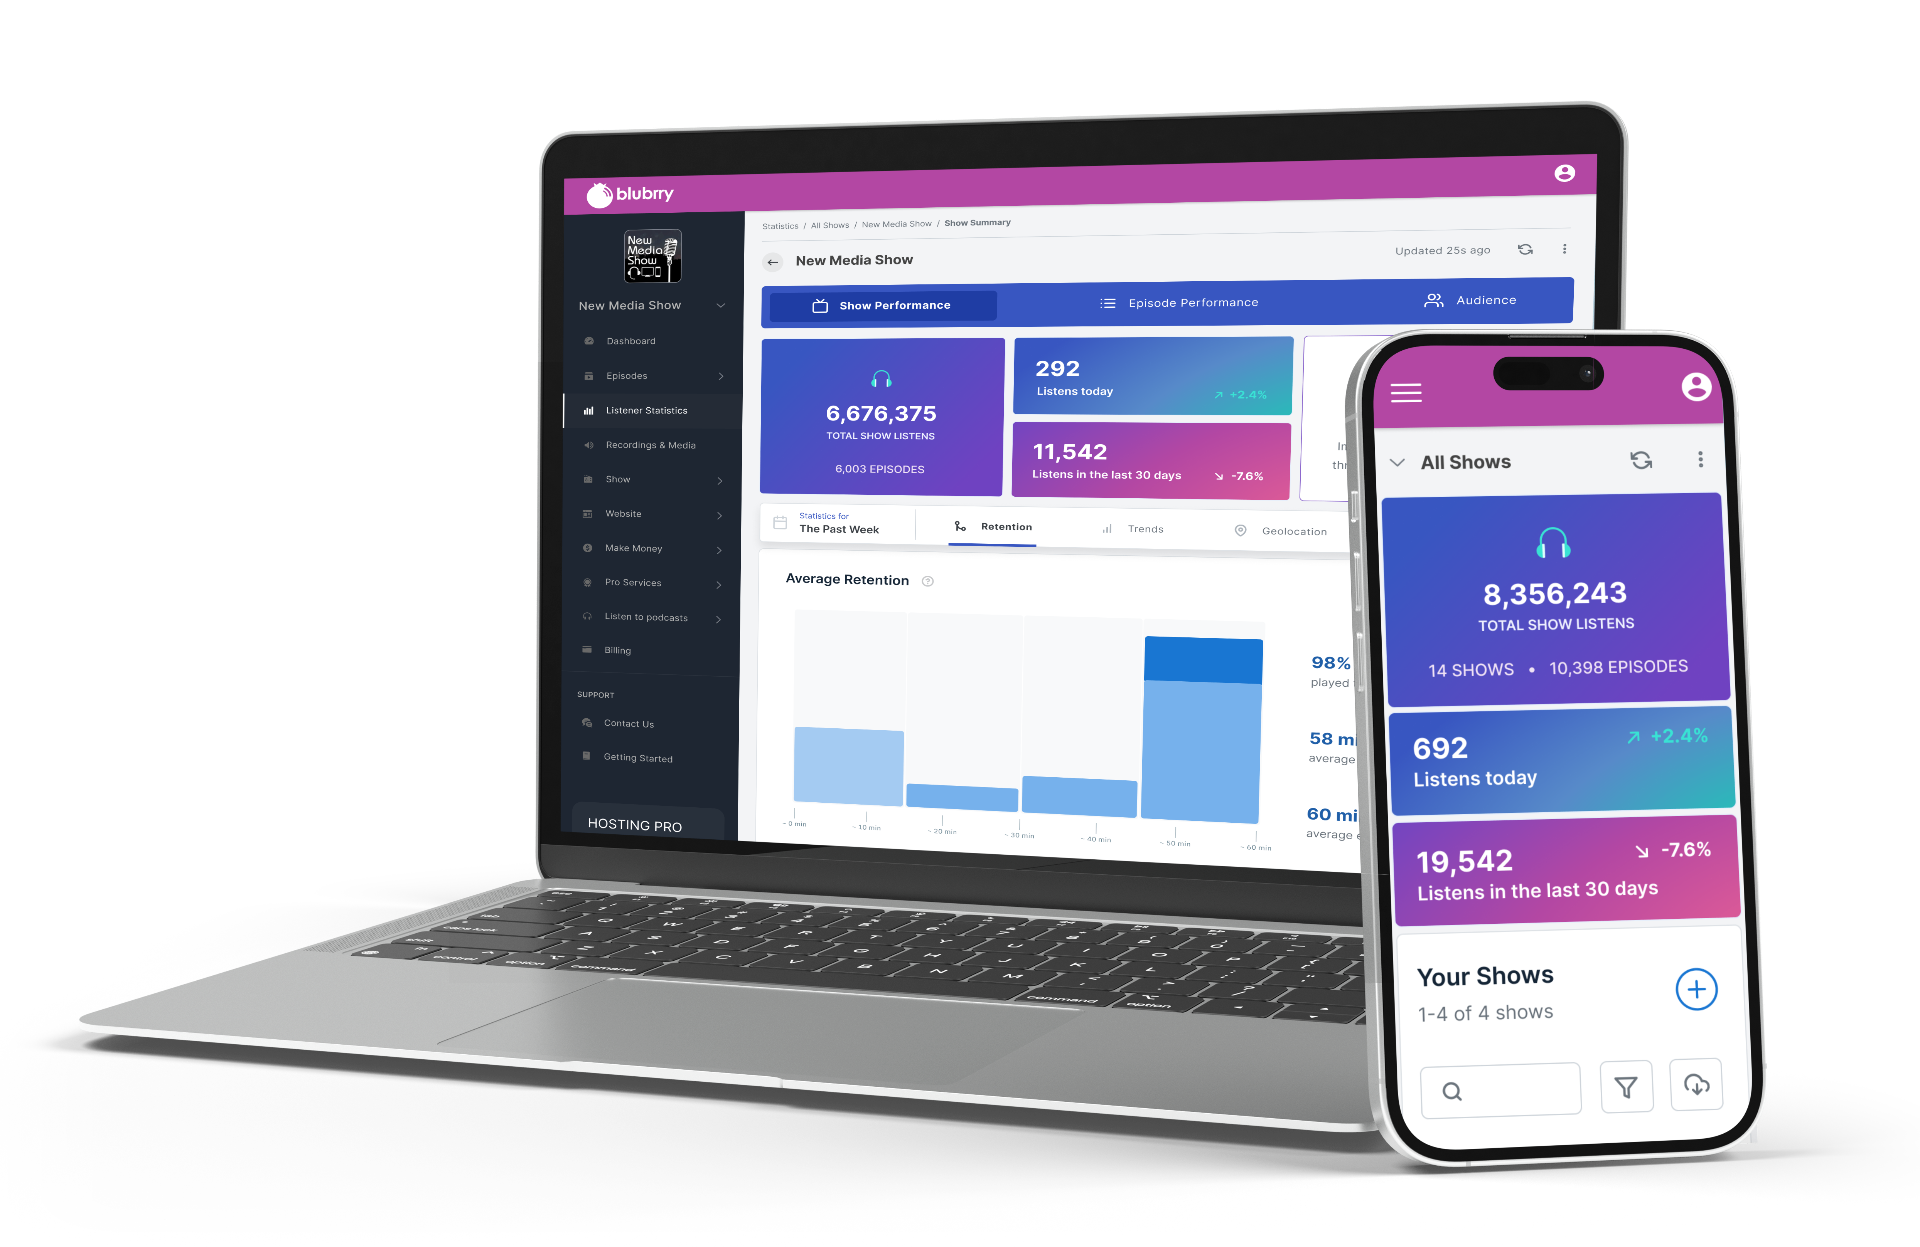
Blubrry Listener Insight Analytics.
A dual-sided analytics platform pairing self-reported listener surveys with anonymized RSS behavioral data — giving podcasters the full picture.
Role
Lead UX Designer
Research · Dashboard Design · Data Visualization
Year
2019
Platform
SaaS Web App
Podcast hosting & analytics
The Problem
Blubrry had two valuable data sources living in silos. Listener survey feedback told creators who their audience said they were, while RSS download data revealed what listeners actually did. Neither source alone told the full story.
- Survey insights lacked behavioral validation
- RSS analytics showed behavior but offered zero audience context
- No single view connected the two, forcing creators to mentally stitch together separate dashboards
- Mobile experience was an afterthought, despite most creators checking stats on phone
The challenge wasn't more data — it was bridging the gap between what listeners say and what they do.
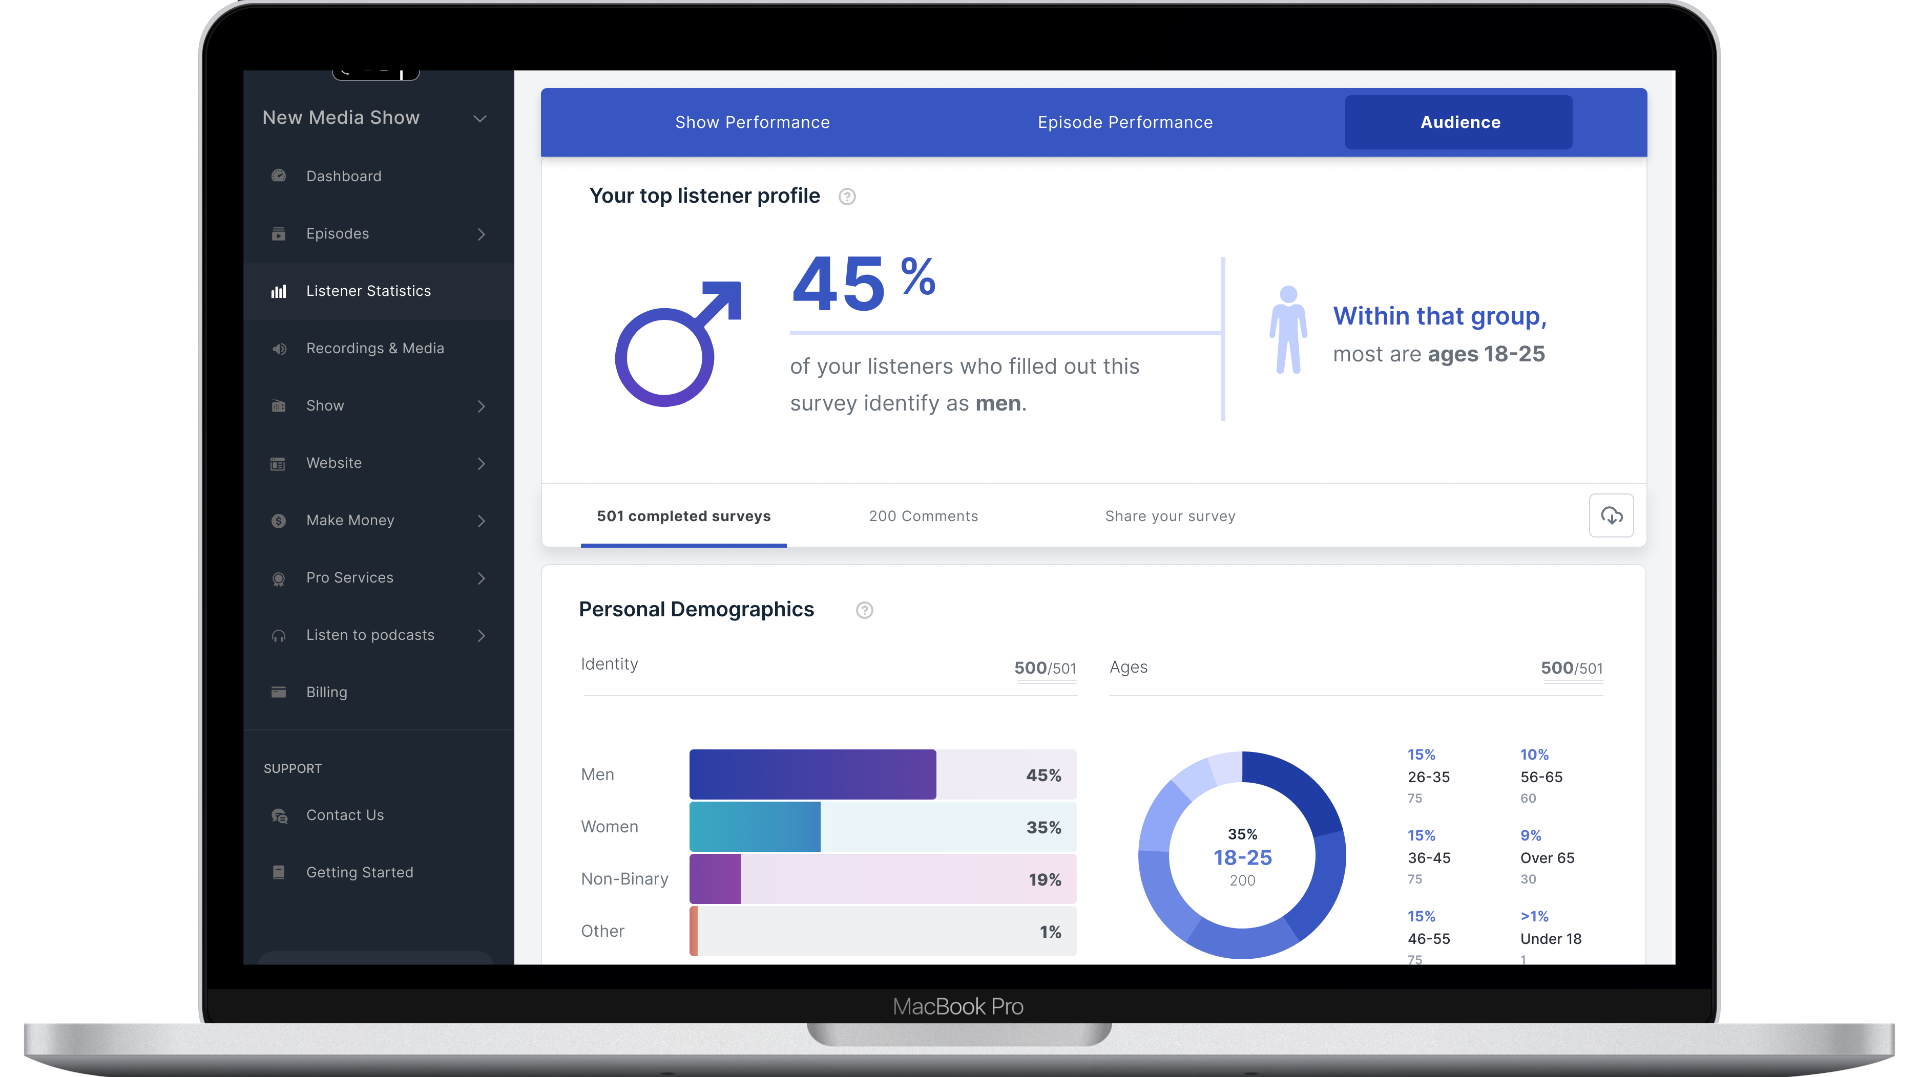
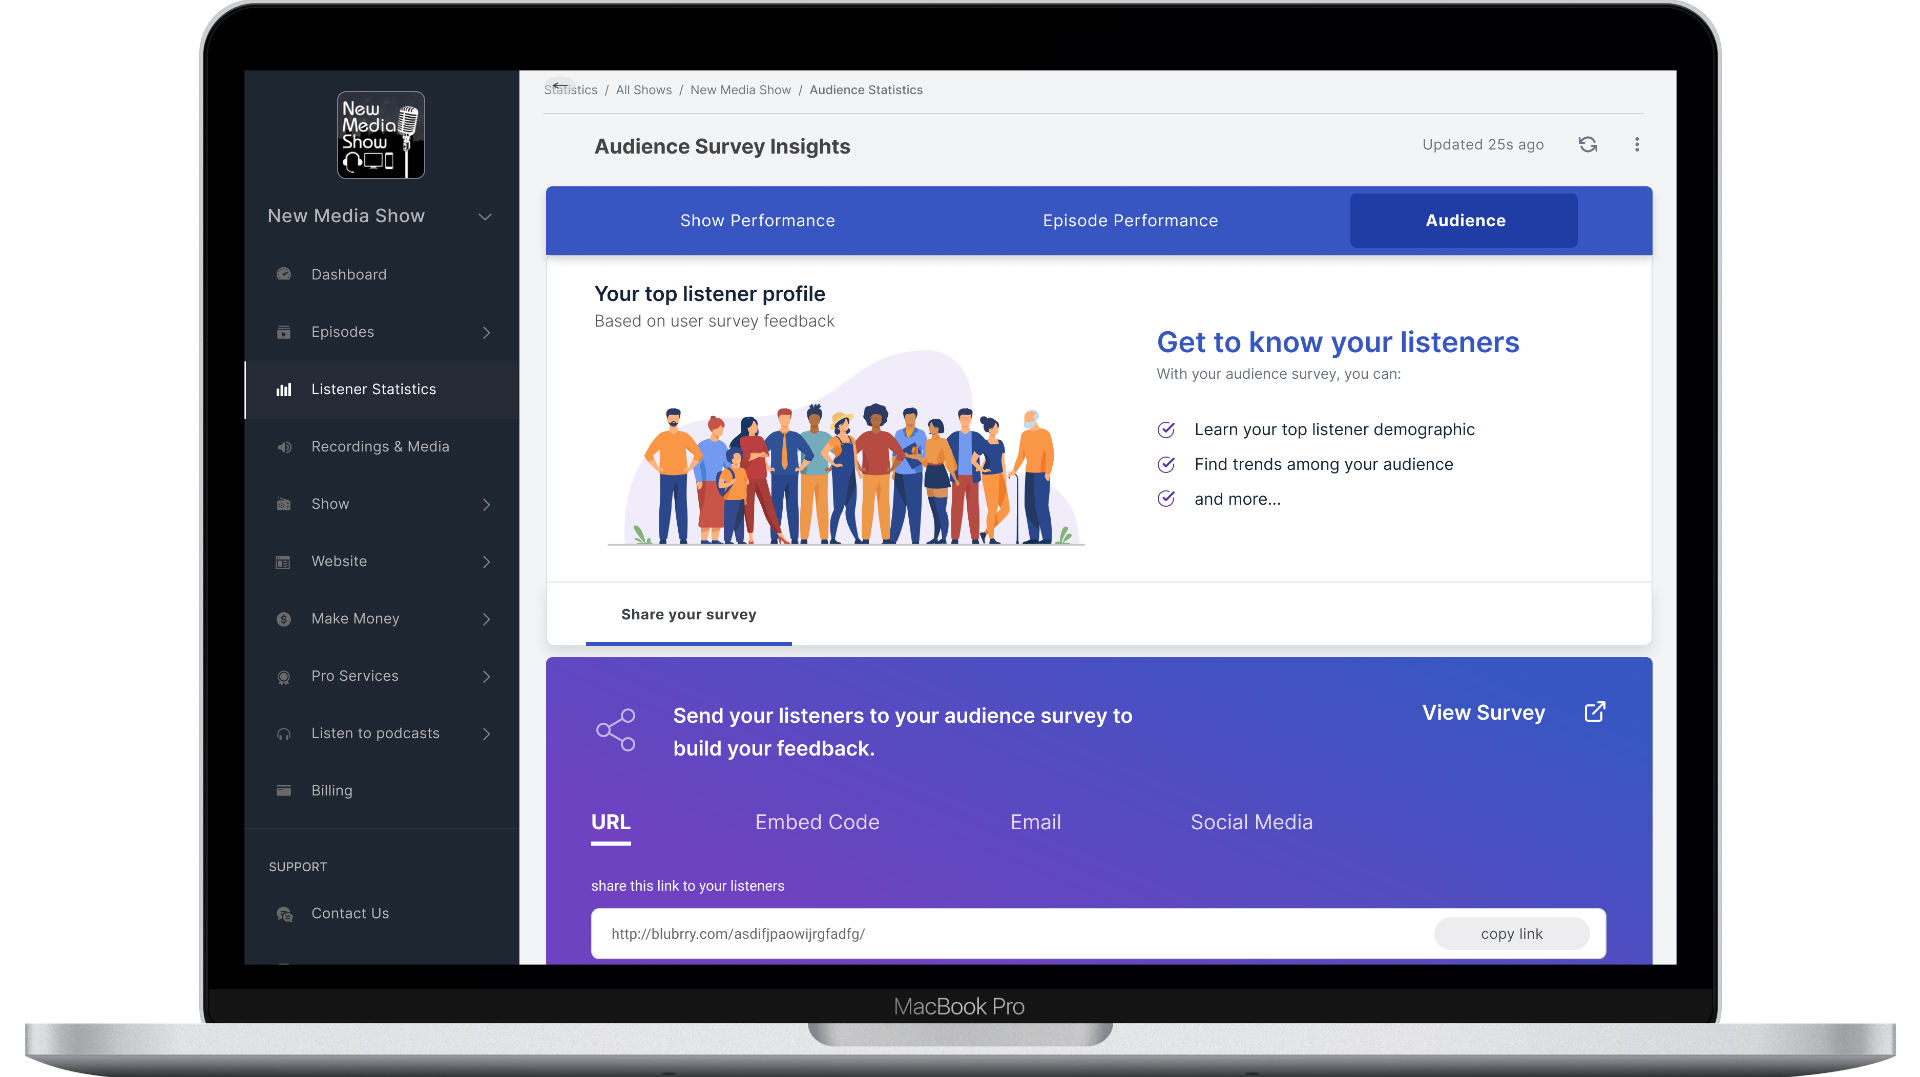
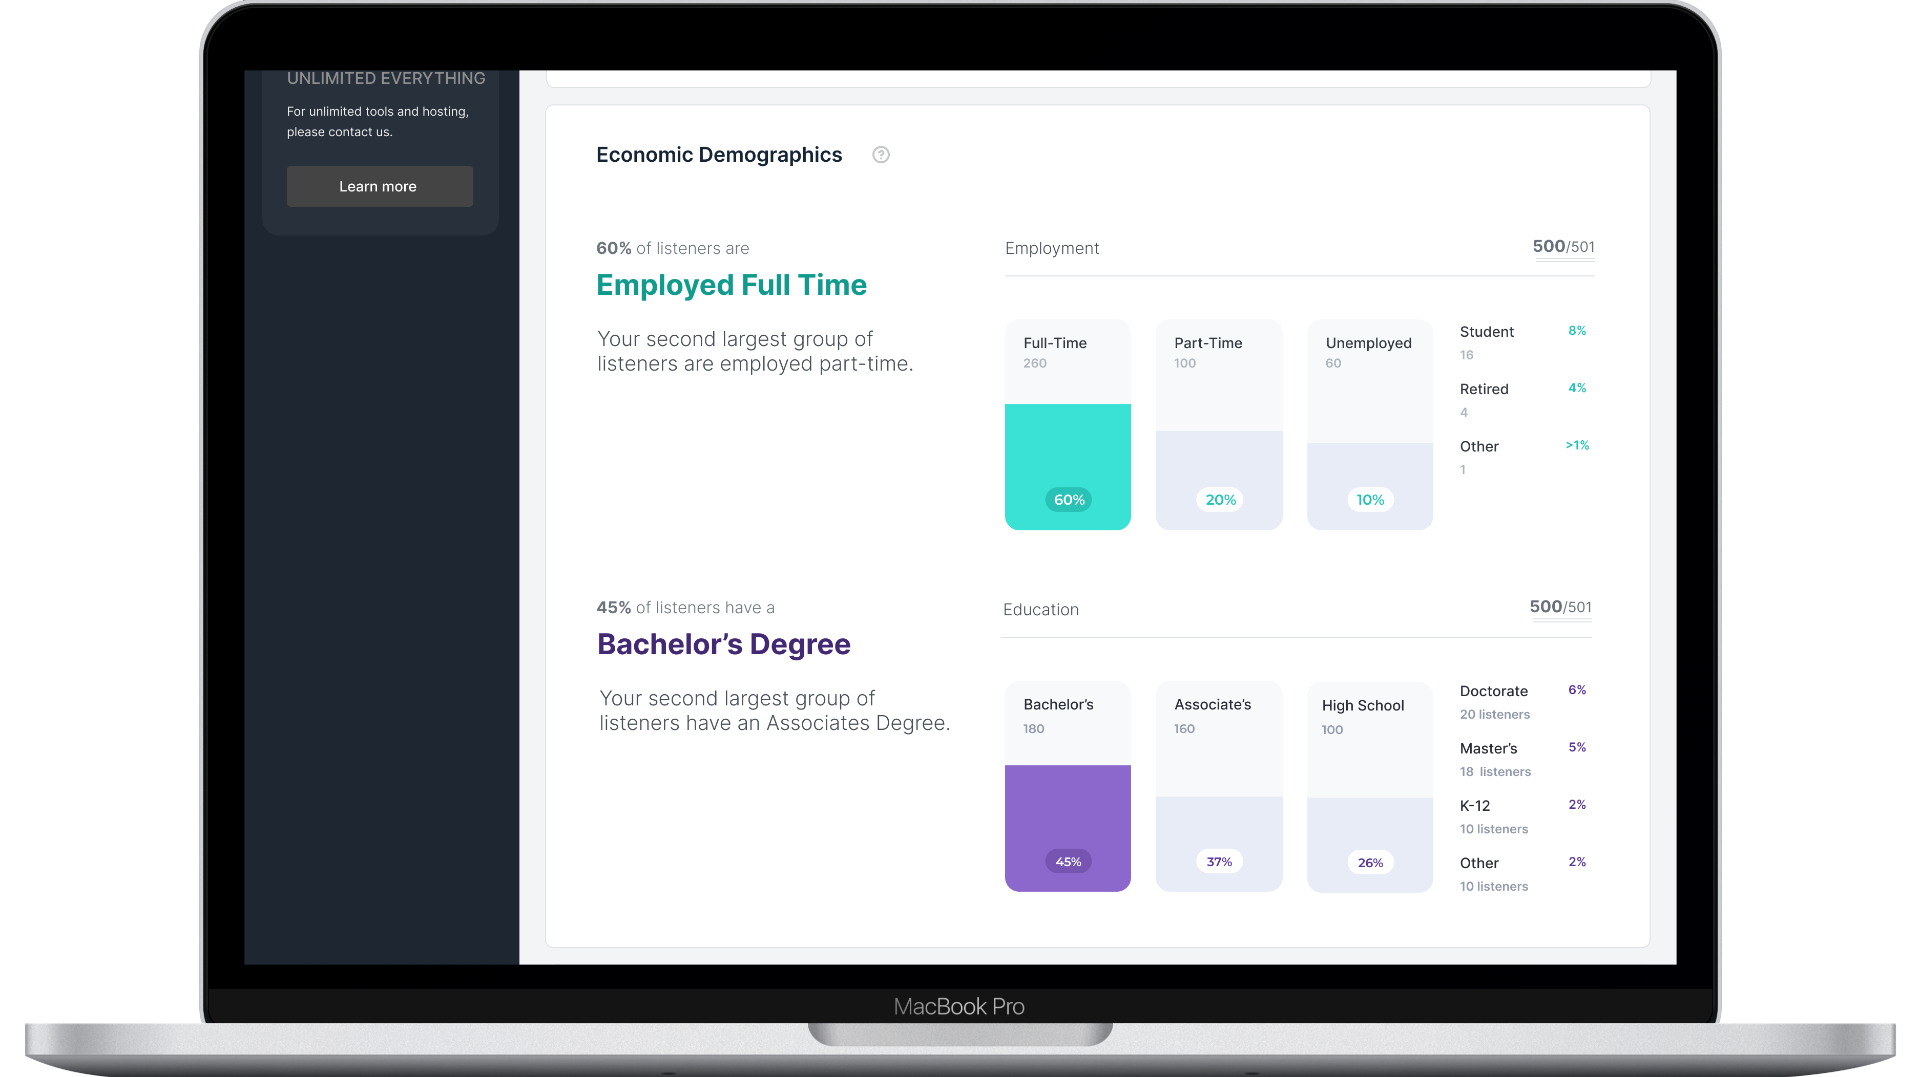
Side 1 — Listener Survey Feedback
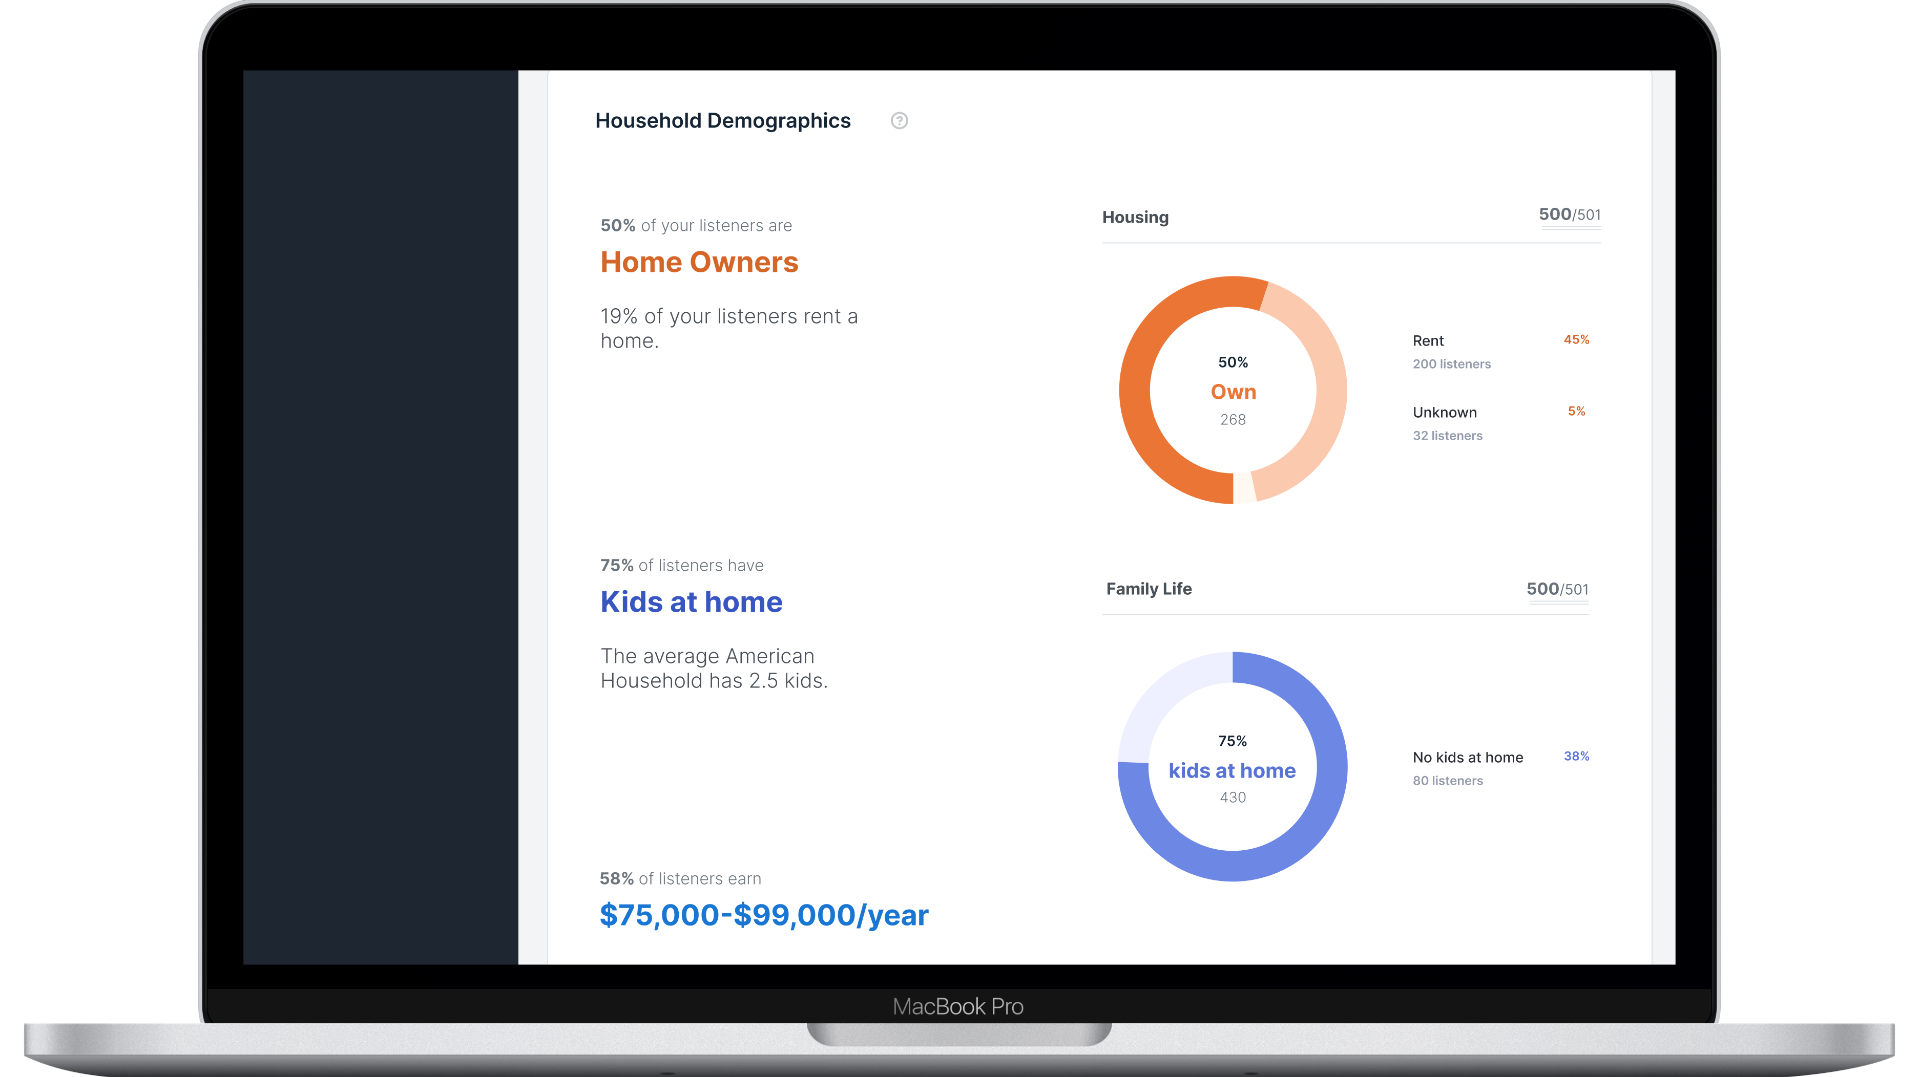
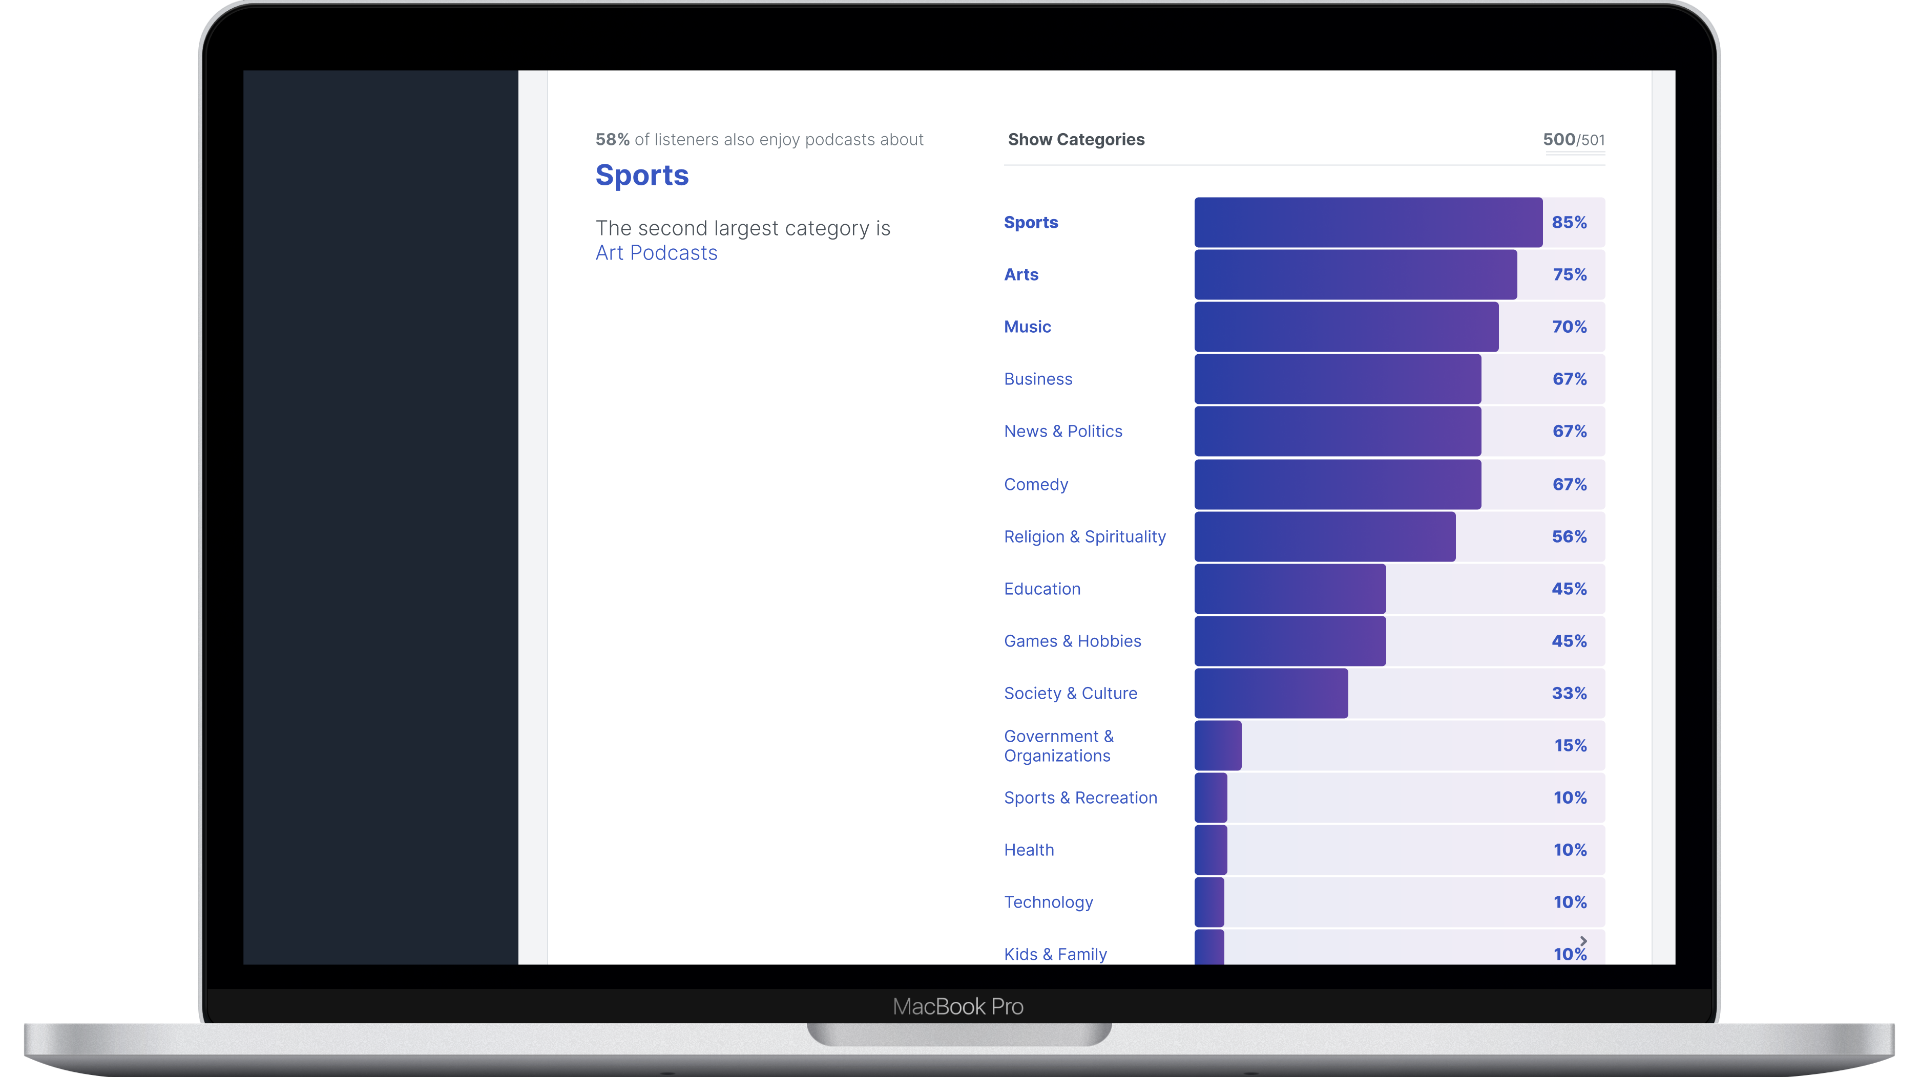
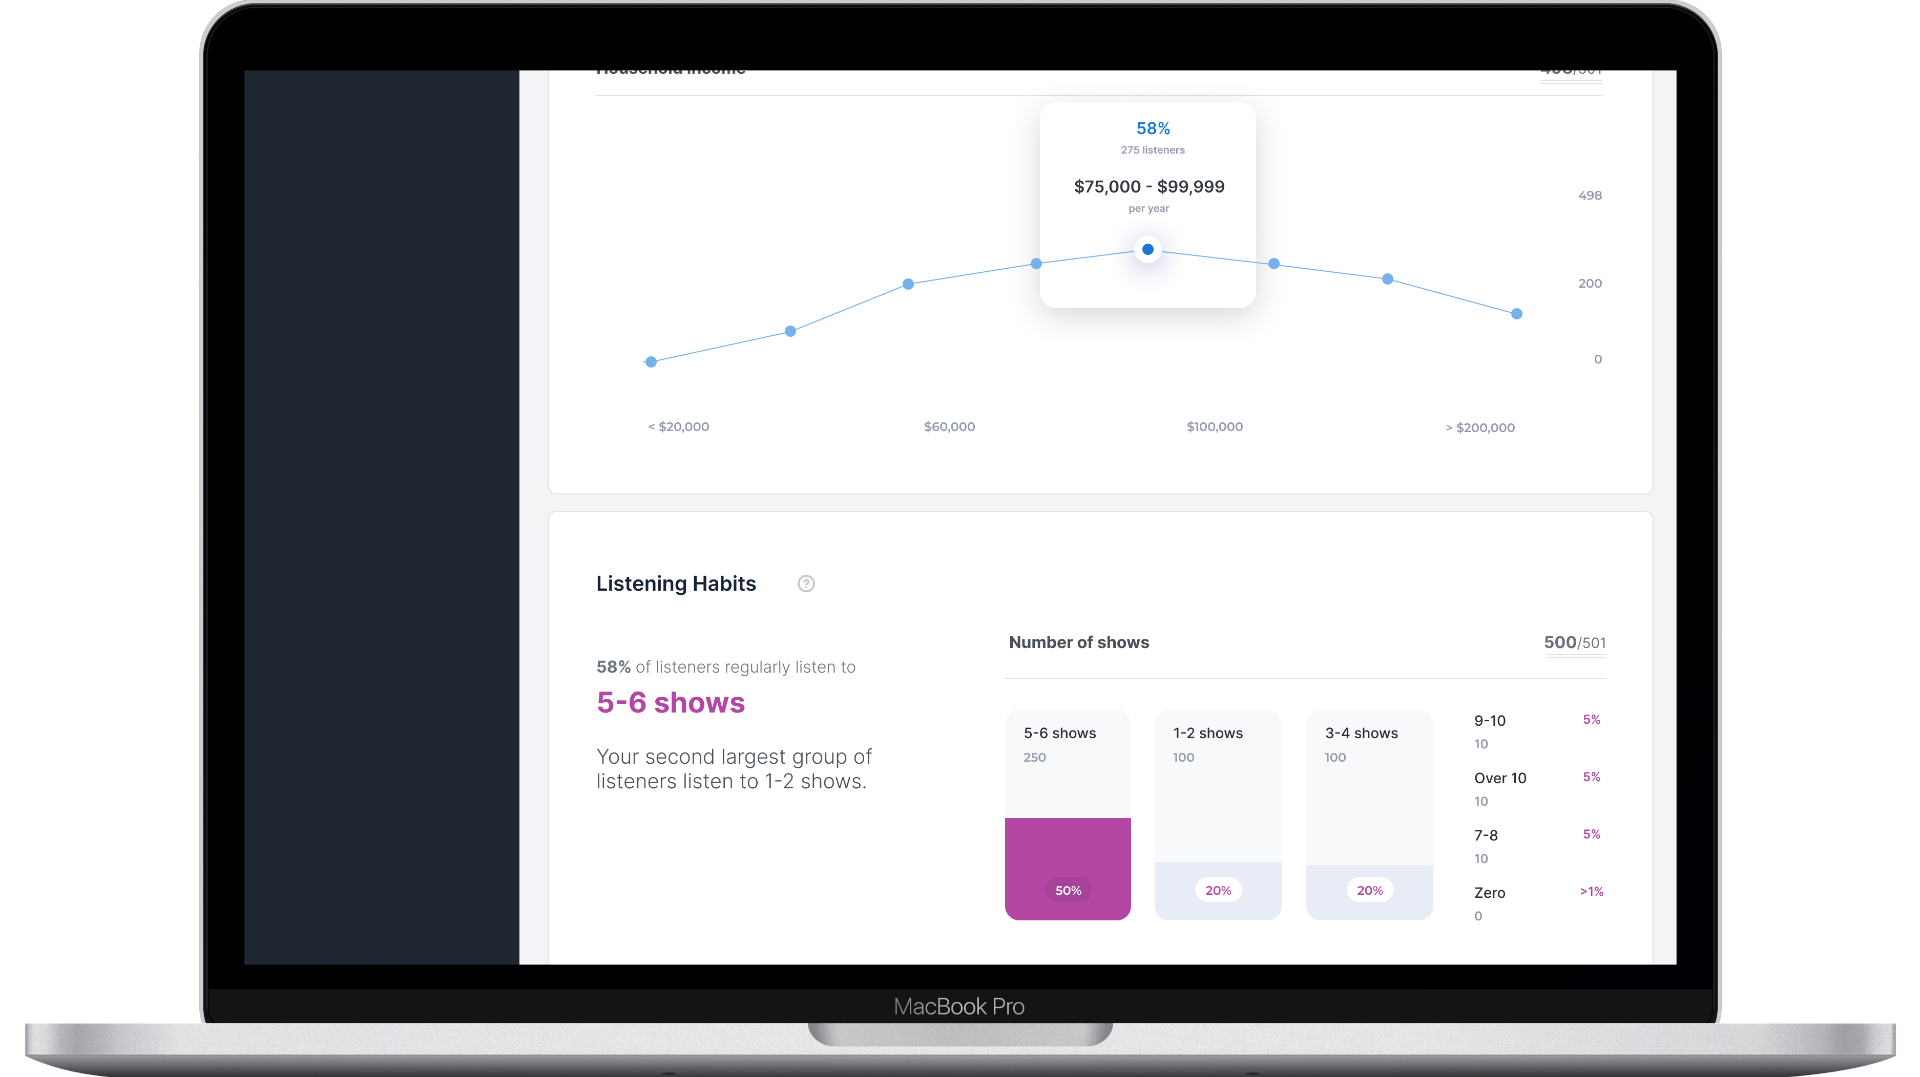
Self-reported audience data: demographics, household info, content interests, and listening habits — building a qualitative profile of their audience.
Side 2 — RSS Listen Analytics
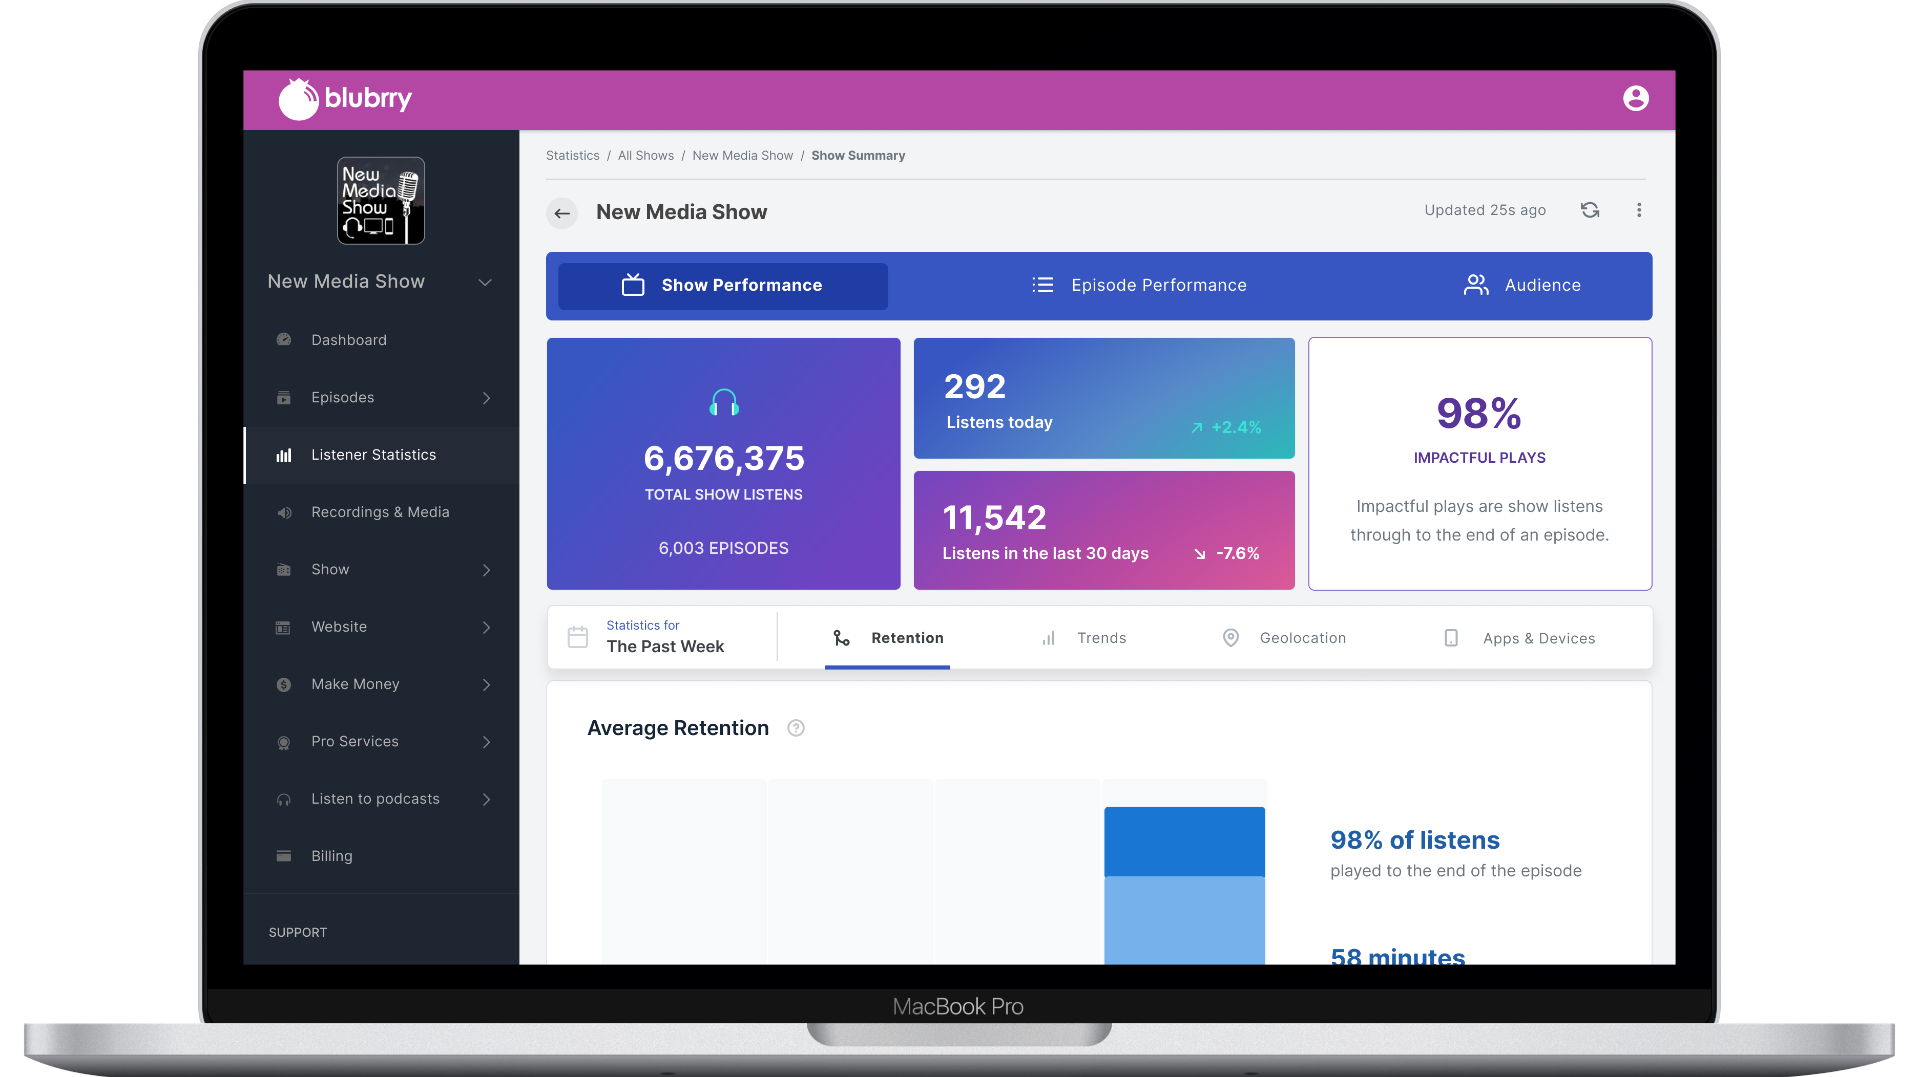
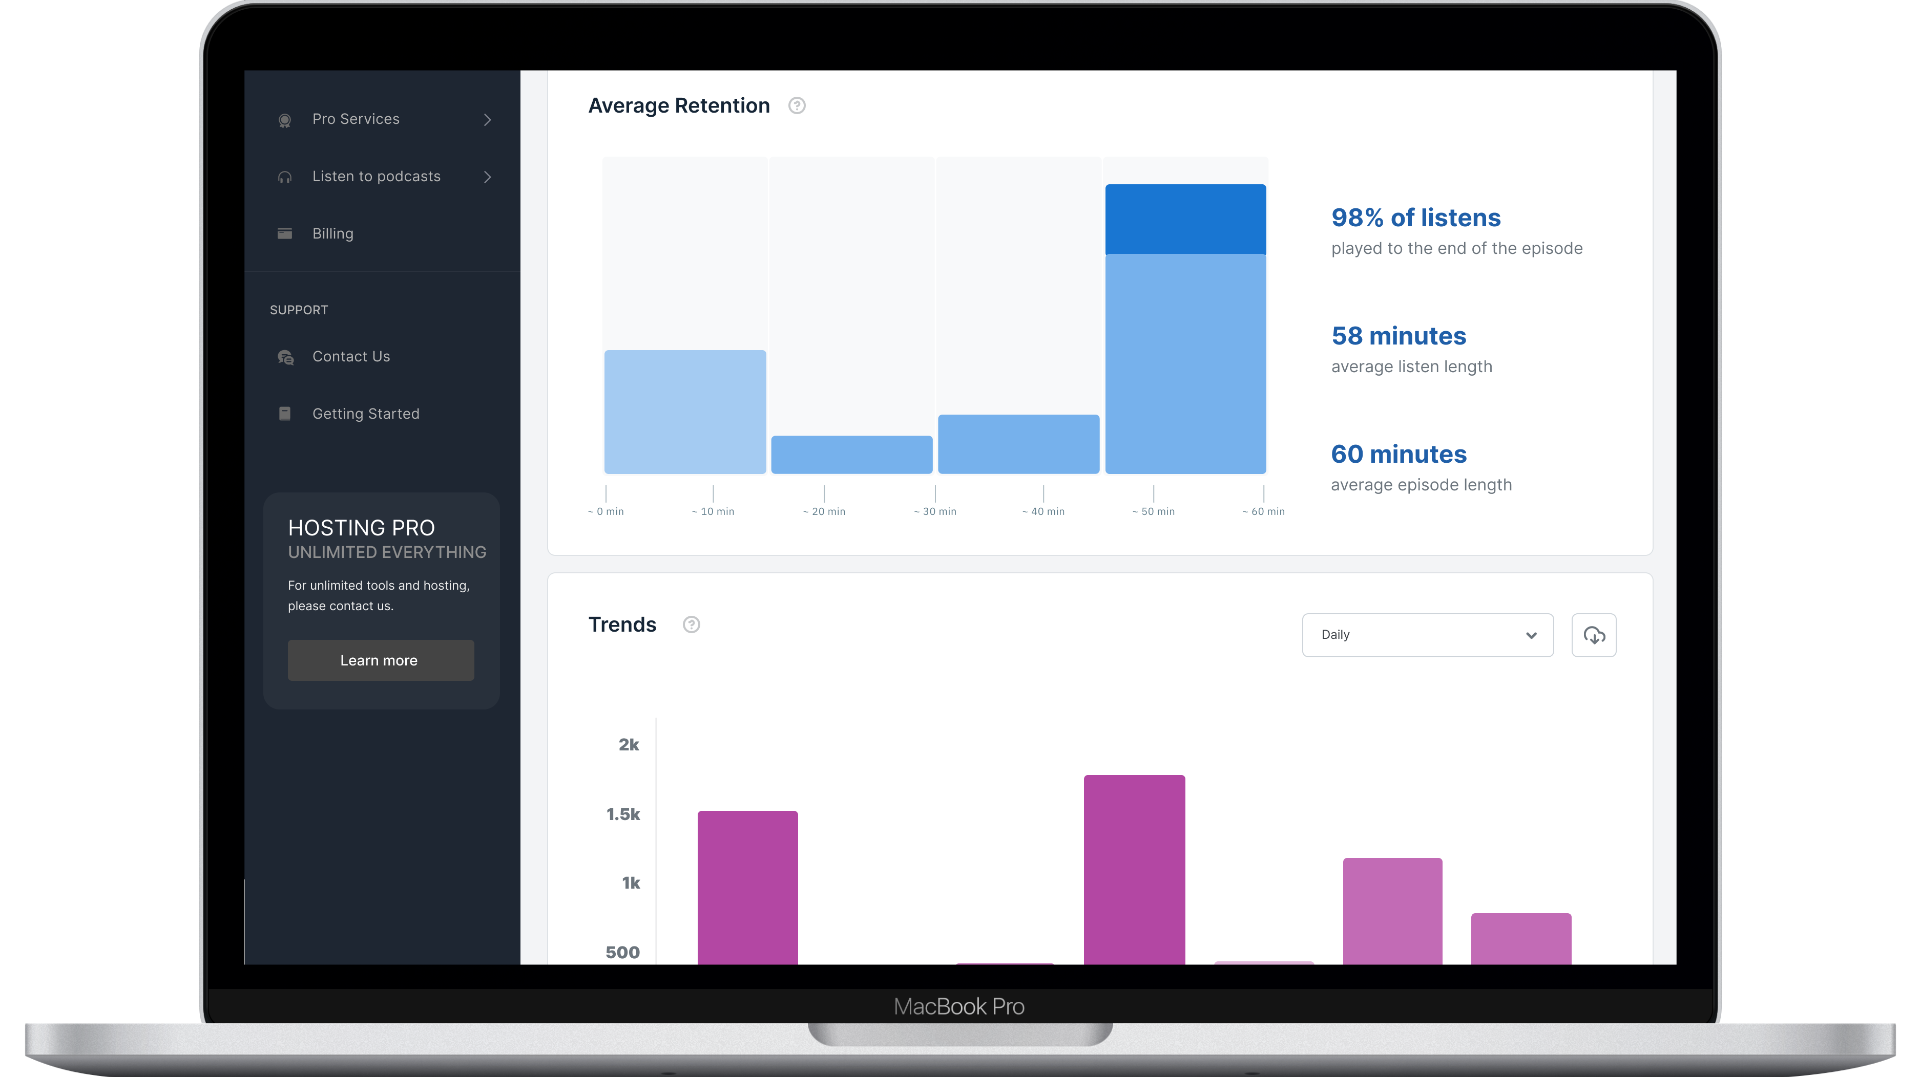
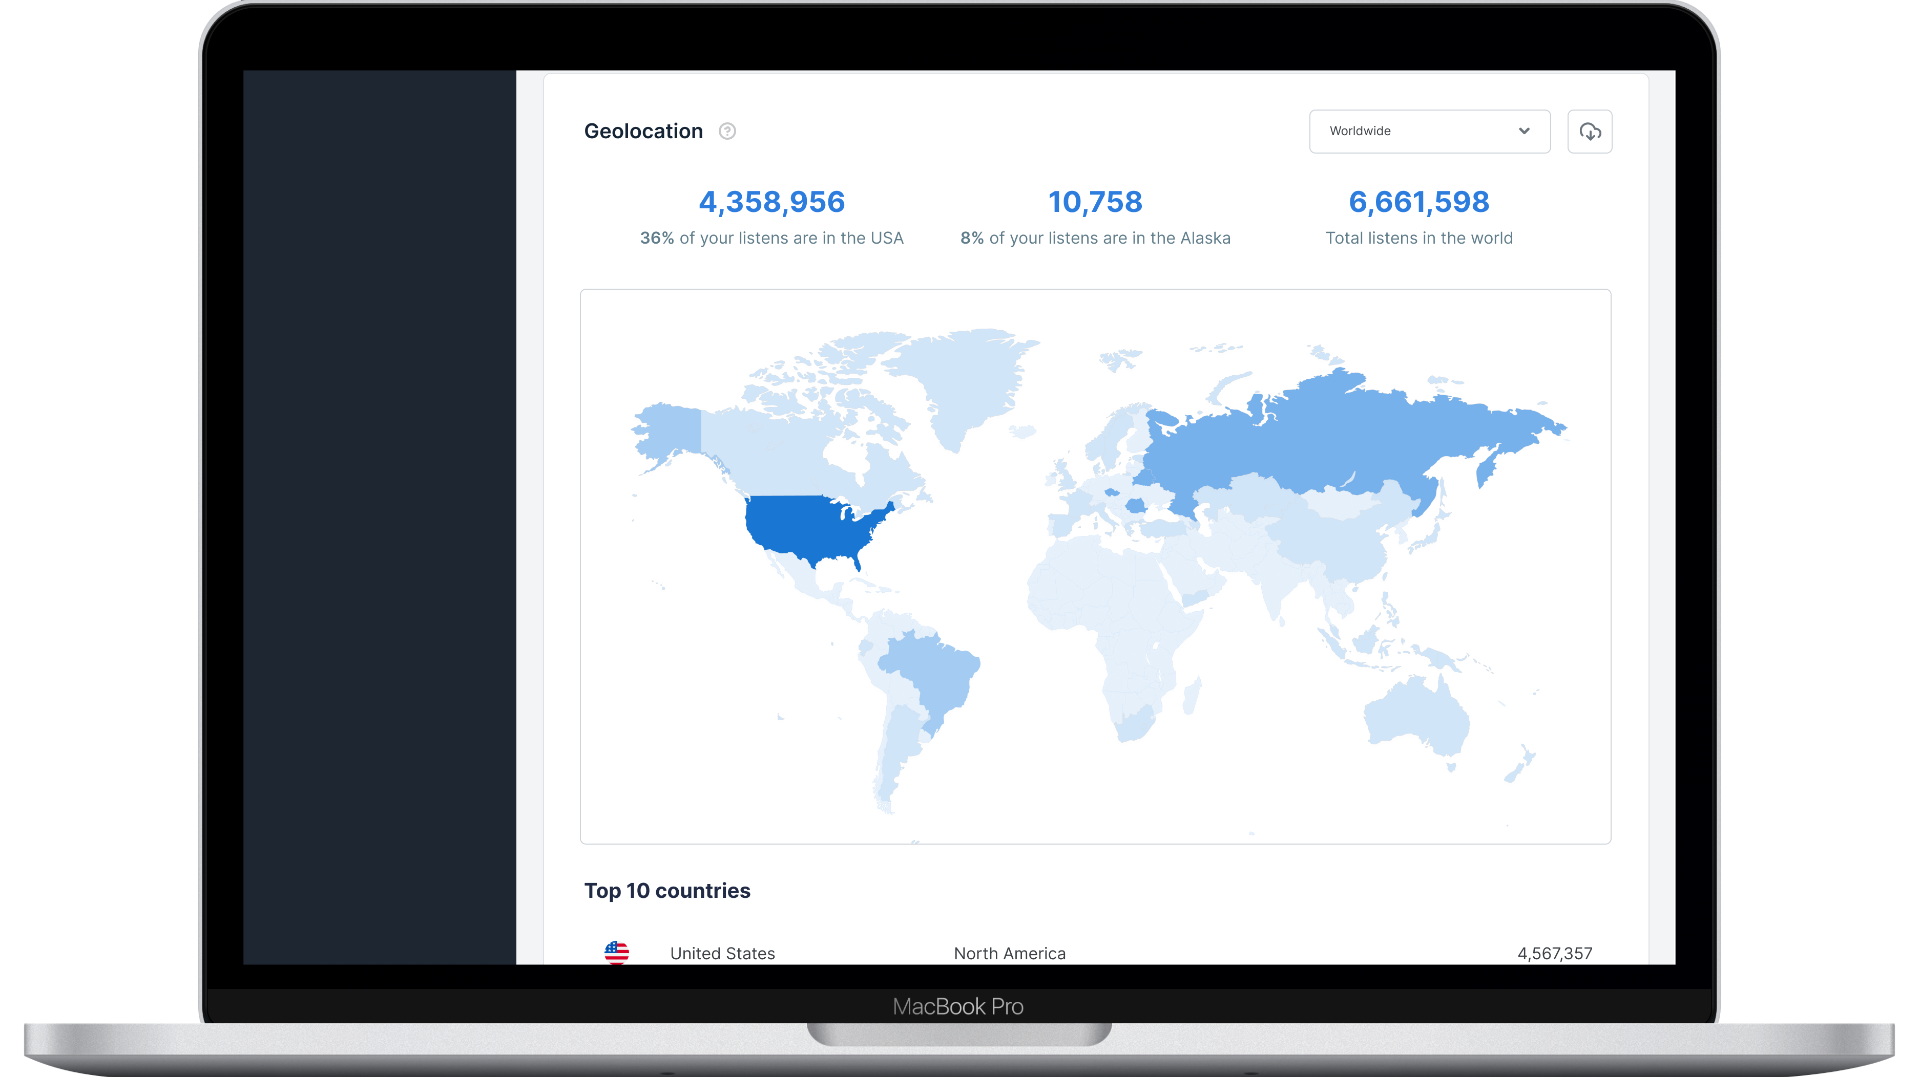
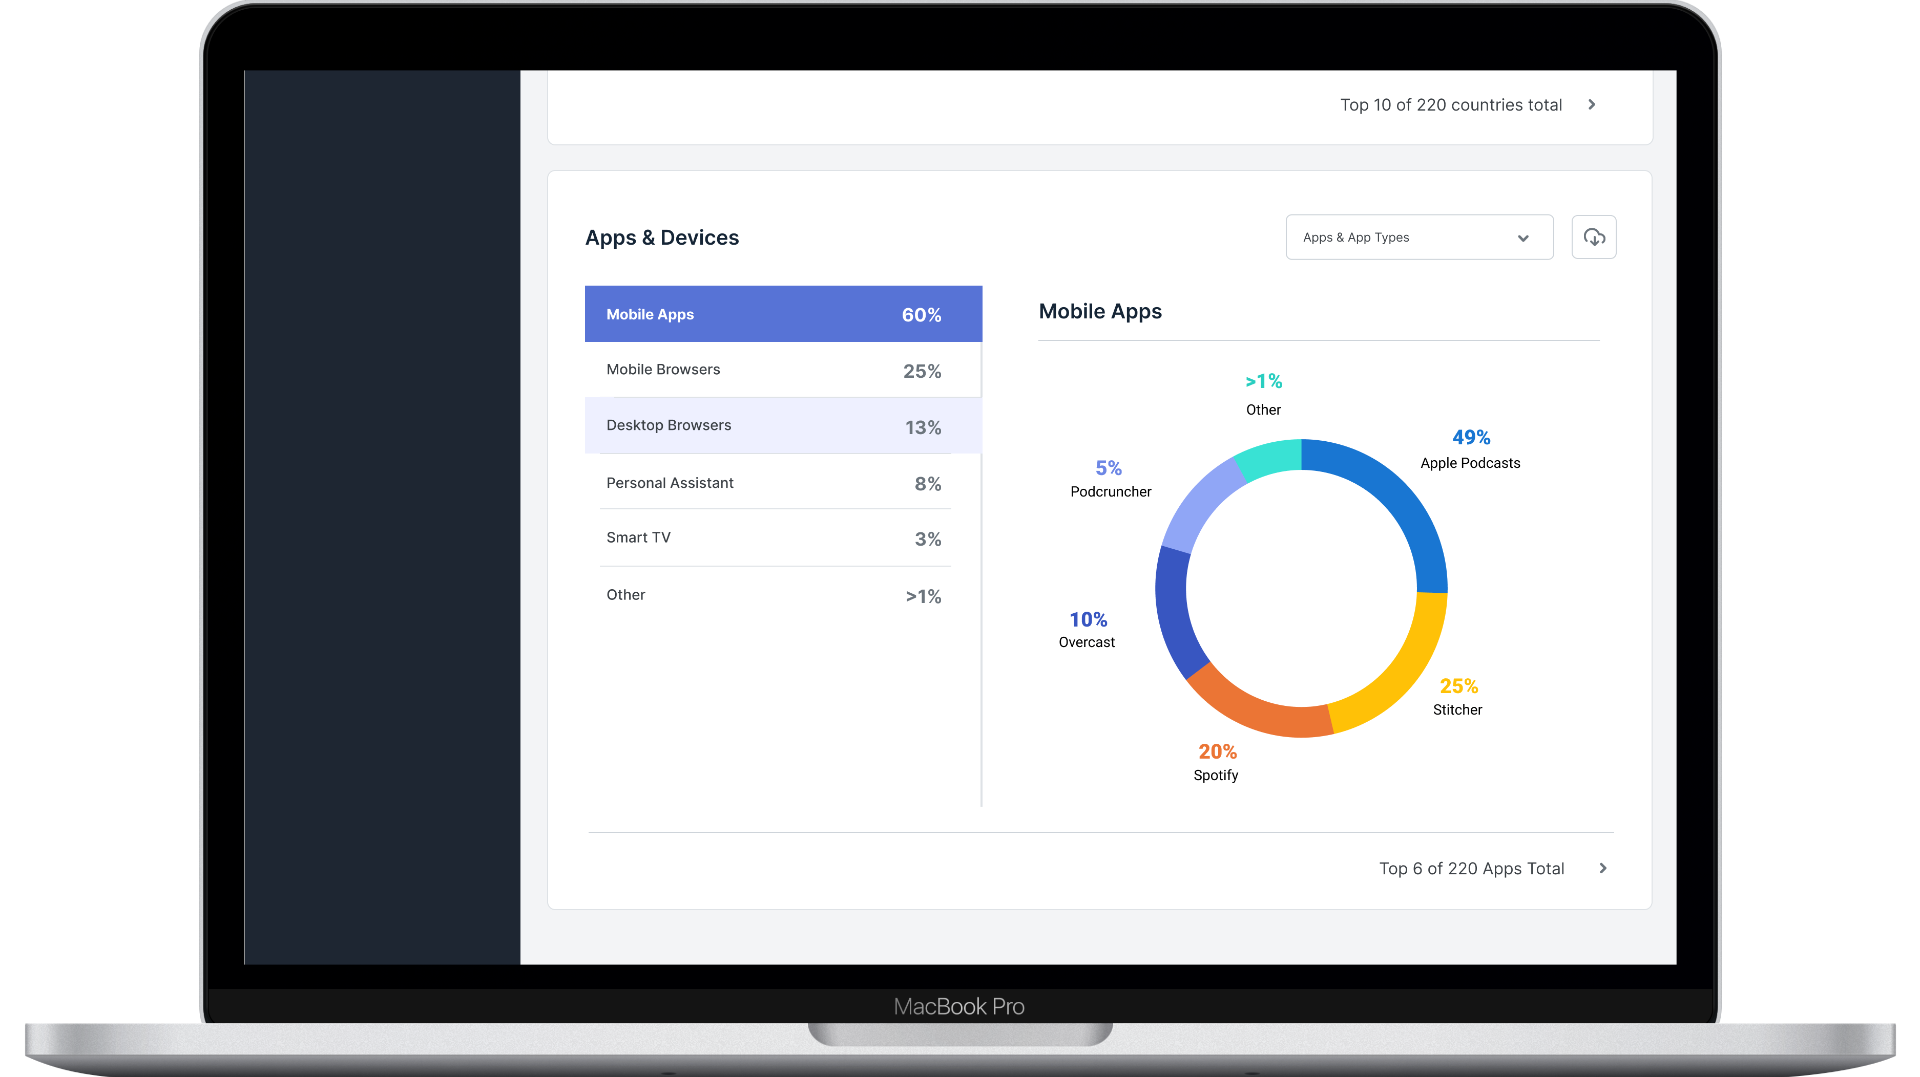
Anonymized behavioral data: download trends, episode retention curves, geographic reach, and app/device distribution.
Design Process
- 01
Creator Research
Contextual interviews with 10 independent podcasters across categories.
- 02
Metric Prioritization
Card-sort exercise identifying that listen-through rate and new subscriber count were most actionable.
- 03
IA Redesign
Restructured from data-centric to task-centric hierarchy — 'How did my last episode do?', 'Am I growing?'
- 04
Visualization Testing
Tested five chart approaches — chose a simplified area chart with milestone markers based on comprehension scores.
Working on something similar? Let's talk.